3.2 KiB
graphql monitoring proxy
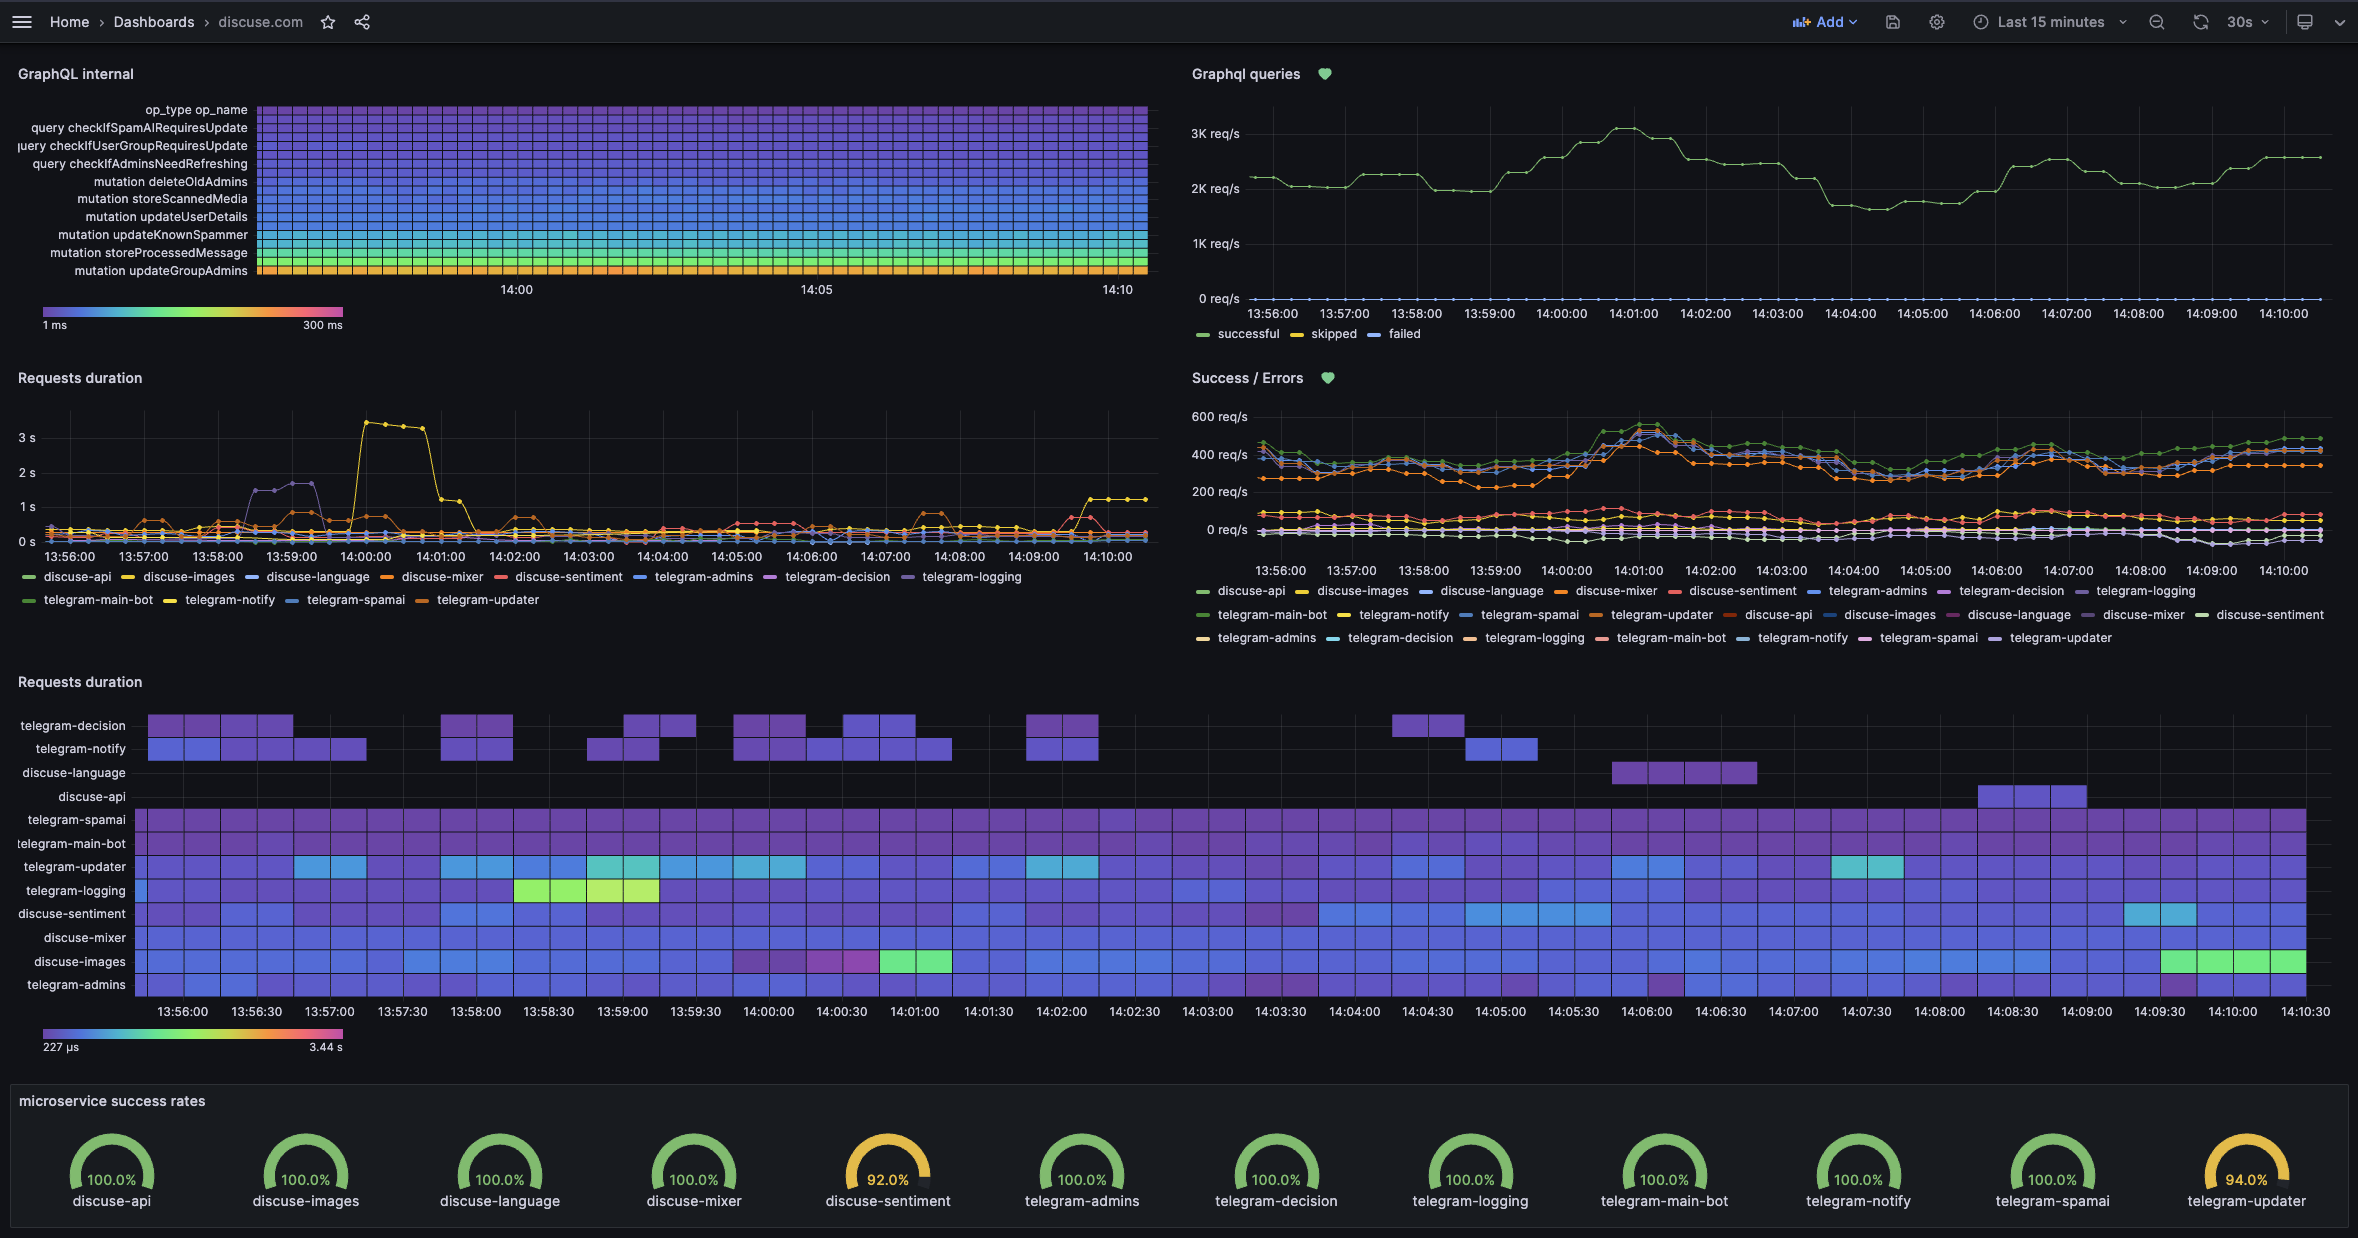
Creates a passthrough proxy to a graphql endpoint(s), allowing you for analysis of the queries and responses, producing the prometheus metrics at a fraction of the cost - because as we know - $0 is a fair price.
This project is in active use by telegram-bot.app, and was tested with 30k queries per second on a single instance, consuming 10mb of RAM and 0.1% CPU.
You can find the example of the kubernetes manifest in the example deployment file.
Why this project exists
I wanted to monitor the queries and responses of our graphql endpoint, but we didn't want to pay the price of the graphql server itself ( and I will not point fingers and certain well-known project), as monitoring and basic security features should be a common, free functionality.
Endpoints
/v1/graphql - the graphql endpoint /metrics - the prometheus metrics endpoint /healthz - the healthcheck endpoint
Features
- MONITORING: Prometheus / VictoriaMetrics metrics
- MONITORING: Extracting user id from JWT token and adding it as a label to the metrics
- MONITORING: Extracting the query name and type and adding it as a label to the metrics
- MONITORING: Calculating the query duration and adding it to the metrics
- SPEED: Caching the queries
- SECURITY: Blocking schema introspection
Configuration
MONITORING_PORT- the port to expose the metrics endpoint on (default: 9393)PORT_GRAPHQL- the port to expose the graphql endpoint on (default: 8080)HOST_GRAPHQL- the host to proxy the graphql endpoint to (default:http://localhost/v1/graphql)JWT_USER_CLAIM_PATH- the path to the user claim in the JWT token (default: ``)ENABLE_CACHE- enable the cache (default:false)CACHE_TTL- the cache TTL (default:60s)LOG_LEVEL- the log level (default:info)BLOCK_SCHEMA_INTROSPECTION- blocks the schema introspection (default:false)
Monitoring endpoint
Example metrics produced by the proxy:
graphql_proxy_timed_query_bucket{cached="false",user_id="-",op_type="mutation",op_name="updateUserDetails",vmrange="1.000e-02...1.136e-02"} 6
graphql_proxy_timed_query_count{op_name="",cached="false",user_id="-",op_type=""} 78
graphql_proxy_timed_query_bucket{op_name="MyQuery",cached="false",user_id="-",op_type="query",vmrange="5.995e+00...6.813e+00"} 1
graphql_proxy_timed_query_sum{op_name="MyQuery",cached="false",user_id="-",op_type="query"} 6
graphql_proxy_timed_query_count{op_name="MyQuery",cached="false",user_id="-",op_type="query"} 1
graphql_proxy_executed_query{user_id="-",op_type="mutation",op_name="updateKnownSpammer",cached="false"} 1486
graphql_proxy_executed_query{user_id="-",op_type="query",op_name="checkIfAdminsNeedRefreshing",cached="false"} 13167
graphql_proxy_executed_query{user_id="1337",op_type="query",op_name="checkIfKnownMedia",cached="false"} 429
graphql_proxy_executed_query{user_id="-",op_type="query",op_name="checkIfSpamAIRequiresUpdate",cached="false"} 8891
graphql_proxy_requests_failed 324
graphql_proxy_requests_skipped 0
graphql_proxy_requests_succesful 454823